

 bpaeducators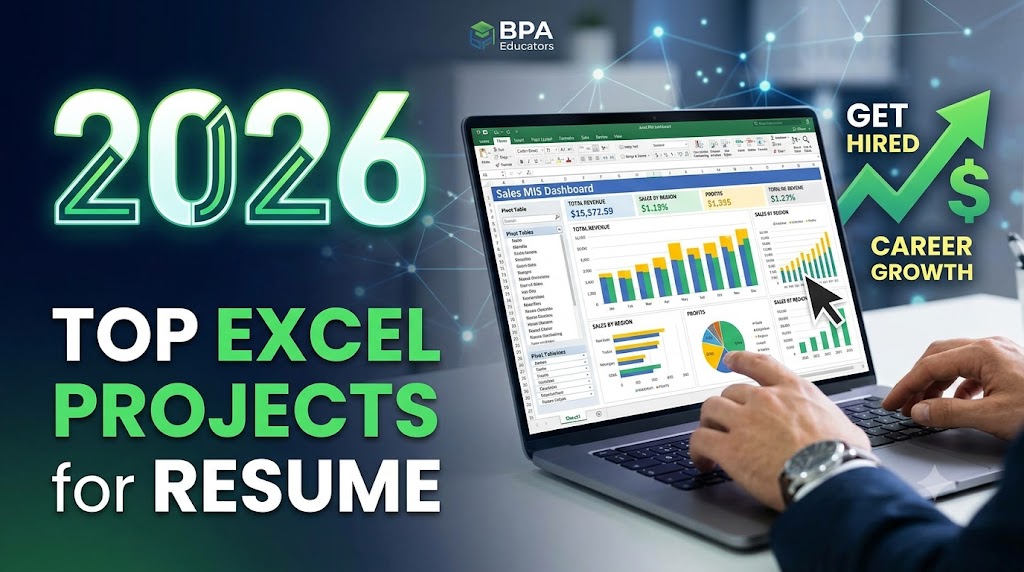
Best Excel Projects to Include in Your Resume in 2026
Practical Excel projects for B.Com students, commerce students, freshers, job seekers, MIS aspirants, accountants and working professionals.
Table of Contents
- Introduction
- Why Excel Projects Matter on a Resume
- Sales MIS Dashboard
- Employee Salary & Payroll Calculator
- Expense Tracker
- Inventory Management System
- Bank Reconciliation Project
- Student Result Analysis Dashboard
- Customer Sales & Outstanding Report
- Monthly Profit & Loss Report
- GST Sales & Purchase Analysis
- Job Application Tracker
- Complete Accountant Excel Workbook
- Excel Skills Matrix
- How to Put Excel Projects on Your Resume
- Building an Excel Portfolio
- Excel + Tally
- Frequently Asked Questions
- Final Takeaway
Want Your Excel Skills to Stand Out on Your Resume?
Writing “Good Knowledge of Excel” on your resume is easy. But when an interviewer asks, “What have you actually created in Excel?”, you need something practical to discuss.
If you are a B.Com student, commerce student, fresher, job seeker, MIS aspirant, accountant or working professional, practical Excel projects can help you demonstrate how you apply your skills.
Show What You Can Build
Instead of simply writing “Advanced Excel” on your resume, demonstrate your ability to create dashboards, reports, trackers, reconciliations and business analysis tools.
Example Resume Entry:
Created a Sales MIS Dashboard using Pivot Tables, XLOOKUP, SUMIFS, charts and conditional formatting.
A project gives an interviewer a concrete starting point for questions about formulas, data analysis, reporting and problem-solving.
Why Are Excel Projects Important for Your Resume?
Excel projects allow you to demonstrate practical skills rather than simply listing software knowledge.
| Excel Skill | What You Can Demonstrate |
|---|---|
| Data Cleaning | Organising and preparing information for analysis. |
| Formulas & Functions | Automating calculations and business logic. |
| Lookup Functions | Finding and connecting related information. |
| Pivot Tables | Summarising and analysing large datasets. |
| Charts | Presenting information visually. |
| MIS Reporting | Converting information into structured reports. |
| Data Validation | Controlling data entry. |
| Conditional Formatting | Identifying important information visually. |
| Dashboards | Presenting key information in a single view. |
| Power Query | Cleaning and transforming data. |
1. Sales MIS Dashboard
A Sales MIS Dashboard is a practical project for students targeting MIS, sales reporting, business reporting and accounting-related roles.
Project Structure
- Sales information
- Product information
- Salesperson information
- Regional information
- Monthly reporting
- Profit analysis
Excel Skills
- Pivot Tables
- Pivot Charts
- SUMIFS
- COUNTIFS
- XLOOKUP
- Conditional Formatting
- Data Validation
- Slicers
- Charts
Dashboard Sections
- Total Sales
- Total Profit
- Product Performance
- Salesperson Performance
- Regional Performance
- Monthly Sales Trend
Sales MIS Dashboard: Developed an interactive Excel dashboard to analyse sales, profitability, product performance and regional performance using Pivot Tables, XLOOKUP, SUMIFS, charts and slicers.
2. Employee Salary & Payroll Calculator
A payroll calculator is a useful Excel project for demonstrating formulas, logical functions and structured calculations.
Recommended Sections
- Employee information
- Department information
- Basic salary
- Allowances
- Deductions
- Gross salary
- Net salary
Excel Functions
- IF
- SUM
- ROUND
- SUMIF
- COUNTIF
Additional Analysis
- Department-wise salary analysis
- Average salary
- Highest salary
- Lowest salary
- Employee count
Employee Payroll Calculator: Created an automated salary calculation workbook using Excel formulas for gross salary, deductions, net salary and department-wise analysis.
3. Expense Tracker
An Expense Tracker can begin as a simple Excel project and be developed into a more advanced reporting system using Pivot Tables, charts and data validation.
Core Sections
- Date
- Expense Category
- Description
- Payment Method
- Amount
- Month
Analysis
- Total expenses
- Monthly expenses
- Category-wise expenses
- Highest expense category
- Payment method analysis
Advanced Features
- Drop-down menus
- Automatic month extraction
- Conditional formatting
- Pivot Tables
- Charts
Expense Tracker: Developed an Excel-based expense tracker with category-wise analysis, monthly summaries, Pivot Tables and charts.
4. Inventory Management System
An Inventory Management System is particularly relevant for students interested in accounting, Tally, retail, trading and business operations.
Project Structure
- Product information
- Category information
- Opening stock
- Purchases
- Sales
- Closing stock
- Reorder level
Important Excel Skills
- IF
- SUMIFS
- XLOOKUP
- Conditional Formatting
- Data Validation
- Pivot Tables
Stock Alert
An IF formula can be used to identify items that require replenishment:
=IF(Closing Stock<=Reorder Level,"REORDER","OK")
Inventory Management System: Built an Excel inventory tracker with automated stock calculations, reorder alerts, product analysis and Pivot Table reporting.
5. Bank Reconciliation Project
Bank reconciliation is a particularly relevant project for accounting students because it combines accounting understanding with Excel-based data comparison and exception identification.
Project Structure
- Book records
- Bank statement records
- Transaction matching
- Unmatched transactions
- Difference identification
- Reconciliation summary
Identify
- Missing transactions
- Amount differences
- Unpresented cheques
- Duplicate entries
- Bank charges
- Direct deposits
Excel Skills
- XLOOKUP
- IF
- COUNTIF
- Conditional Formatting
- Data Cleaning
- Duplicate Detection
Bank Reconciliation Project: Created an Excel reconciliation system to compare book transactions with bank statement records and identify unmatched transactions.
6. Student Result Analysis Dashboard
A Student Result Analysis Dashboard demonstrates logical functions, calculations, data analysis and visual reporting.
Project Structure
- Student information
- Class information
- Subject information
- Marks
- Percentage
- Result
- Grade
Formula Practice
A logical condition can be used to classify a result:
=IF(B2>=50,"Pass","Fail")
Analysis
- Total marks
- Percentage
- Grade
- Subject average
- Highest score
- Lowest score
- Pass percentage
Dashboard
- Subject-wise performance
- Top-performing students
- Class average
- Pass percentage
- Fail count
Student Result Analysis Dashboard: Designed an Excel dashboard to analyse marks, grades, subject performance and pass percentages using formulas, Pivot Tables and charts.
7. Customer Sales & Outstanding Report
This project is relevant for accounting, finance, billing and sales-related roles because it focuses on receivables and collections.
Project Structure
- Customer information
- Invoice information
- Invoice date
- Invoice amount
- Amount received
- Outstanding amount
- Due date
- Status
Outstanding Calculation
The basic calculation is:
=Invoice Amount-Amount Received
Reporting Features
- Total receivables
- Total amount received
- Total outstanding amount
- Overdue accounts
- Customer-wise outstanding
Customer Outstanding Report: Created an Excel receivables tracker to monitor invoices, collections, outstanding amounts and overdue accounts.
Excel Skills Matrix for Your Project Portfolio
Different projects can be used to demonstrate different Excel skills. This makes it easier to select projects according to the job role.
| Excel Skill | Project Where It Can Be Demonstrated |
|---|---|
| IF | Student Result Analysis |
| SUMIFS | Sales MIS Dashboard |
| COUNTIFS | Employee Analysis |
| XLOOKUP | Customer Report |
| VLOOKUP | Product Database |
| Pivot Tables | Sales Dashboard |
| Charts | MIS Dashboard |
| Conditional Formatting | Outstanding Report |
| Data Validation | Expense Tracker |
| Power Query | Data Cleaning |
| Dashboard | Sales MIS |
| Reconciliation | Bank Reconciliation |
Choose Projects According to Your Target Role
The project should match the type of work you want to perform.
Accounting: Bank Reconciliation, Customer Outstanding, GST Analysis and Profit & Loss.
MIS: Sales MIS Dashboard, Employee MIS, Expense Dashboard and Inventory Dashboard.
General Fresher: Sales Dashboard, Payroll Calculator, Inventory Management and Expense Tracker.
8. Monthly Profit & Loss Report
A Monthly Profit & Loss Report is particularly relevant for students learning accounting, Tally, GST and Excel together.
Income Section
- Sales
- Other Income
Expense Section
- Salary
- Rent
- Electricity
- Advertising
- Transportation
- Other Expenses
Profit Calculation
Profit = Income − Expenses
Additional Analysis
- Month-wise comparison
- Expense percentage
- Profit trend
- Charts
- Dashboard
Monthly Profit & Loss Report: Developed an Excel-based financial reporting model to analyse monthly revenue, expenses and profitability.
9. GST Sales & Purchase Analysis
A GST Sales and Purchase Analysis project can demonstrate how Excel can be used to organise and analyse accounting information containing GST-related fields.
Project Structure
- Invoice information
- Date
- Customer or supplier
- State
- Taxable value
- GST rate
- CGST
- SGST
- IGST
- Invoice total
Analysis
- Taxable sales
- GST collected
- CGST
- SGST
- IGST
- State-wise sales
- Monthly sales
GST Sales Analysis: Created an Excel report to organise and analyse GST-related sales information by month, state, tax type and taxable value.
10. Job Application Tracker
A Job Application Tracker demonstrates Excel-based data management, data validation, conditional formatting and status tracking.
Recommended Columns
- Company
- Position
- Application Date
- Location
- Contact
- Interview Date
- Status
- Follow-up Date
- Remarks
Status Dropdown
- Applied
- Screening
- Interview
- Selected
- Rejected
Additional Features
- Conditional formatting
- Upcoming interview alerts
- Pending follow-up identification
- Status summary
- Dashboard reporting
Job Application Tracker: Built an Excel-based application management system using data validation, conditional formatting, status tracking and dashboard summaries.
Bonus Project: Complete Accountant Excel Workbook
Students targeting accounting positions can combine several practical Excel skills into one structured workbook.
| Sheet | Purpose |
|---|---|
| Sales Data | Sales transaction reporting. |
| Purchase Data | Purchase transaction reporting. |
| Expenses | Expense tracking and analysis. |
| Customers | Customer information management. |
| Outstanding | Receivables tracking. |
| Bank Reconciliation | Bank and book transaction comparison. |
| MIS Dashboard | Business reporting and analysis. |
| Profit & Loss | Financial performance reporting. |
This creates a complete mini accounting and MIS project that can be explained during an interview from transaction-level information through reporting.
How Many Excel Projects Should You Put on Your Resume?
A fresher does not need a long list of Excel projects. Focus on a small number of projects that are complete, relevant and easy to explain.
For Accounting Roles
- Bank Reconciliation
- Customer Outstanding Report
- GST Sales Analysis
- Profit & Loss Report
For MIS Roles
- Sales MIS Dashboard
- Employee MIS
- Expense Dashboard
- Inventory Dashboard
For General Fresher Roles
- Sales Dashboard
- Payroll Calculator
- Inventory Management
- Expense Tracker
Relevance Matters More Than Quantity
Select projects according to the job description and the skills expected in the role.
How to Put Excel Projects on Your Resume
Avoid using a generic heading such as “Excel Project”. Give the project a clear professional name and explain what you created.
Sales MIS Dashboard
Tools: Microsoft Excel, Pivot Tables, XLOOKUP, SUMIFS and Charts
Description: Created an interactive sales dashboard analysing monthly sales, profitability, regional performance and product performance.
Recommended Resume Structure
| Section | What to Include |
|---|---|
| Project Name | Clear project title. |
| Tools | Relevant Excel functions and features. |
| Objective | Purpose of the project. |
| Work Performed | What you created and analysed. |
| Output | Dashboard, report, tracker or analysis. |
How to Build an Excel Project Portfolio
1. Raw Data
Keep the source information organised separately from calculations and final reporting.
2. Calculations
Keep important calculations structured and understandable.
3. Analysis
Use formulas, Pivot Tables and appropriate analytical methods.
4. Dashboard
Present the most important information using suitable KPIs, charts and filters.
5. Documentation
Include an instructions section explaining:
- Project objective
- Information used
- Functions used
- Features included
- Key findings
- How the workbook works
Professional Excel Project Rules
- Keep dashboards clean and easy to understand.
- Use meaningful worksheet names.
- Maintain consistent formatting.
- Use appropriate number formats.
- Protect important formula cells where necessary.
- Use filters for large datasets.
- Use Excel Tables where appropriate.
- Add an instructions or documentation sheet.
Excel + Tally for Accounting Careers
Students preparing for accounting roles can combine Excel projects with TallyPrime learning to develop a broader understanding of accounting data and reporting.
A practical workflow can move from transaction recording to analysis and management reporting:
Accounting Data to MIS Reporting
TallyPrime
Record and manage accounting transactions.
↓
Excel
Organise, analyse and process accounting information.
↓
MIS Report
Present useful business information.
↓
Management Reporting
Communicate relevant information through structured reports.
This is why students targeting accounting and MIS positions can benefit from developing skills across accounting software, Advanced Excel and reporting.
What Should You Be Able to Explain in an Interview?
Building an Excel project is only one part of preparation. You should also understand the project well enough to explain your decisions.
- What problem does the project solve?
- What information does it use?
- Why did you choose particular formulas?
- Why did you use a Pivot Table?
- How did you structure the dashboard?
- What calculations did you automate?
- What did you learn while creating the project?
Do Not Memorise Your Project
Understand it. An interviewer may change the question or ask you to explain one specific formula or reporting decision.
Frequently Asked Questions About Excel Projects
Are Excel projects useful for freshers?
Yes. Practical projects give freshers specific examples that demonstrate how they have applied Excel skills.
Which Excel projects are useful for accounting students?
Bank reconciliation, customer outstanding reporting, GST-related analysis and Profit & Loss reporting are relevant project areas for accounting students.
Which Excel projects are useful for MIS Executive roles?
Sales MIS dashboards, employee reports, inventory dashboards and expense reporting can demonstrate MIS-related Excel skills.
Should Excel projects be included on a fresher resume?
Relevant projects can be included, particularly when the applicant has limited professional experience. Each project should clearly explain what was created and which skills were used.
How many Excel projects should a fresher create?
Focus on a manageable portfolio of relevant, complete projects rather than creating a large number of unfinished projects.
Which Excel functions are useful for accounting jobs?
Important functions include SUM, IF, SUMIF, SUMIFS, COUNTIF, COUNTIFS, XLOOKUP, VLOOKUP, IFERROR and ROUND. Pivot Tables, charts, conditional formatting, data validation and Power Query are also useful areas to develop.
Useful Excel & Accounting Resources
Microsoft Excel Support
Microsoft Excel Templates
Tally Solutions
GST Portal
Build Your Excel Skills at BPA Educators, Rohini
Learning Excel effectively means moving beyond individual formulas and understanding how those features can be applied to practical business and accounting tasks.
BPA Educators provides training in areas including:
- Basic Excel
- Advanced Excel
- Excel Formulas & Functions
- Pivot Tables
- MIS Reporting
- Excel Dashboards
- Data Analysis
- Practical Projects
- TallyPrime
- GST Accounting
- Computer Skills
The focus is to help students move from learning software features to applying those skills to practical accounting, reporting and workplace requirements.
Final Takeaway
Your resume should not simply say that you know Excel. It should demonstrate what you can do with Excel.
Build projects such as:
- Sales MIS Dashboard
- Employee Payroll Calculator
- Inventory Management System
- Bank Reconciliation
- GST Sales Analysis
- Profit & Loss Report
- Customer Outstanding Report
Select projects according to the job role you are targeting. Then understand every formula, calculation, report and dashboard included in the project.
Learn Excel. Build projects. Show your skills.
Build Practical Excel & Accounting Skills
Learn Advanced Excel, MIS Reporting, TallyPrime, GST Accounting and job-oriented computer skills through practical training.
Book Your FREE Demo Class Enroll in BPA Educators