
 admin
admin 
How to Create MIS Reports in Excel – Step-by-Step Guide | Advanced Excel Training in Rohini, Delhi
Imagine your manager asks for a monthly sales report.
Instead of spending hours sorting data manually, you can create a professional MIS report in minutes using Excel.
That is the power of MIS Reports in Excel.Lets Learn How to create MIS Reports in Excel
MIS Reporting is one of the most demanded skills for Data Entry Operators, MIS Executives, Accountants, Office Executives, Business Analysts, and Working Professionals. :contentReference[oaicite:0]{index=0}
- What MIS Reporting is
- How to organize raw data
- Important Excel formulas
- Pivot Tables and Charts
- MIS Dashboards
- Career opportunities in MIS Reporting
What is an MIS Report?
MIS stands for Management Information System.
An MIS Report in excel helps management collect, analyze, and present business data in a meaningful way for decision-making. :contentReference[oaicite:1]{index=1}
MIS Reports help organizations track:
- Sales Performance
- Employee Productivity
- Revenue Trends
- Expenses
- Customer Data
- Inventory Status
- Business Growth
Why is MIS Reporting Important?
Companies rely heavily on MIS Reports because they:
- Save Time
- Improve Decision-Making
- Track KPIs
- Identify Trends
- Reduce Manual Work
- Increase Business Efficiency
Skills Required to Create MIS Reports in Excel
- Excel Formulas
- Pivot Tables
- Conditional Formatting
- Charts & Graphs
- Data Validation
- VLOOKUP / XLOOKUP
- SUMIFS
- COUNTIFS
- Dashboard Creation
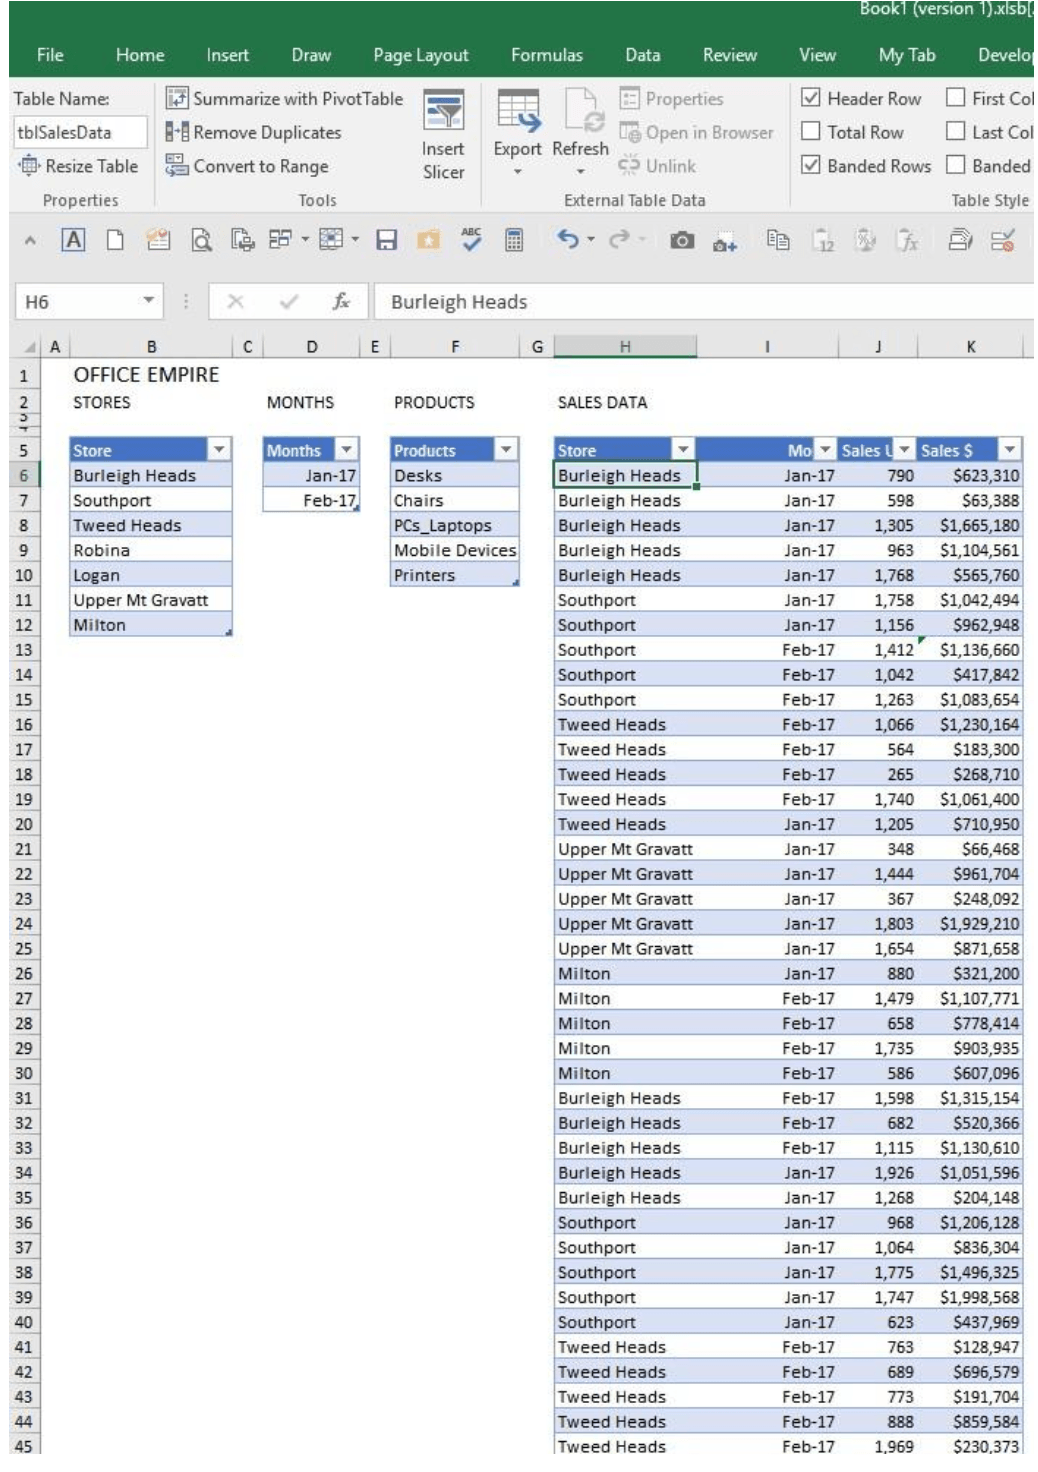
Step 1: Organize Your Raw Data
Before creating any report, ensure your data is clean and properly structured.
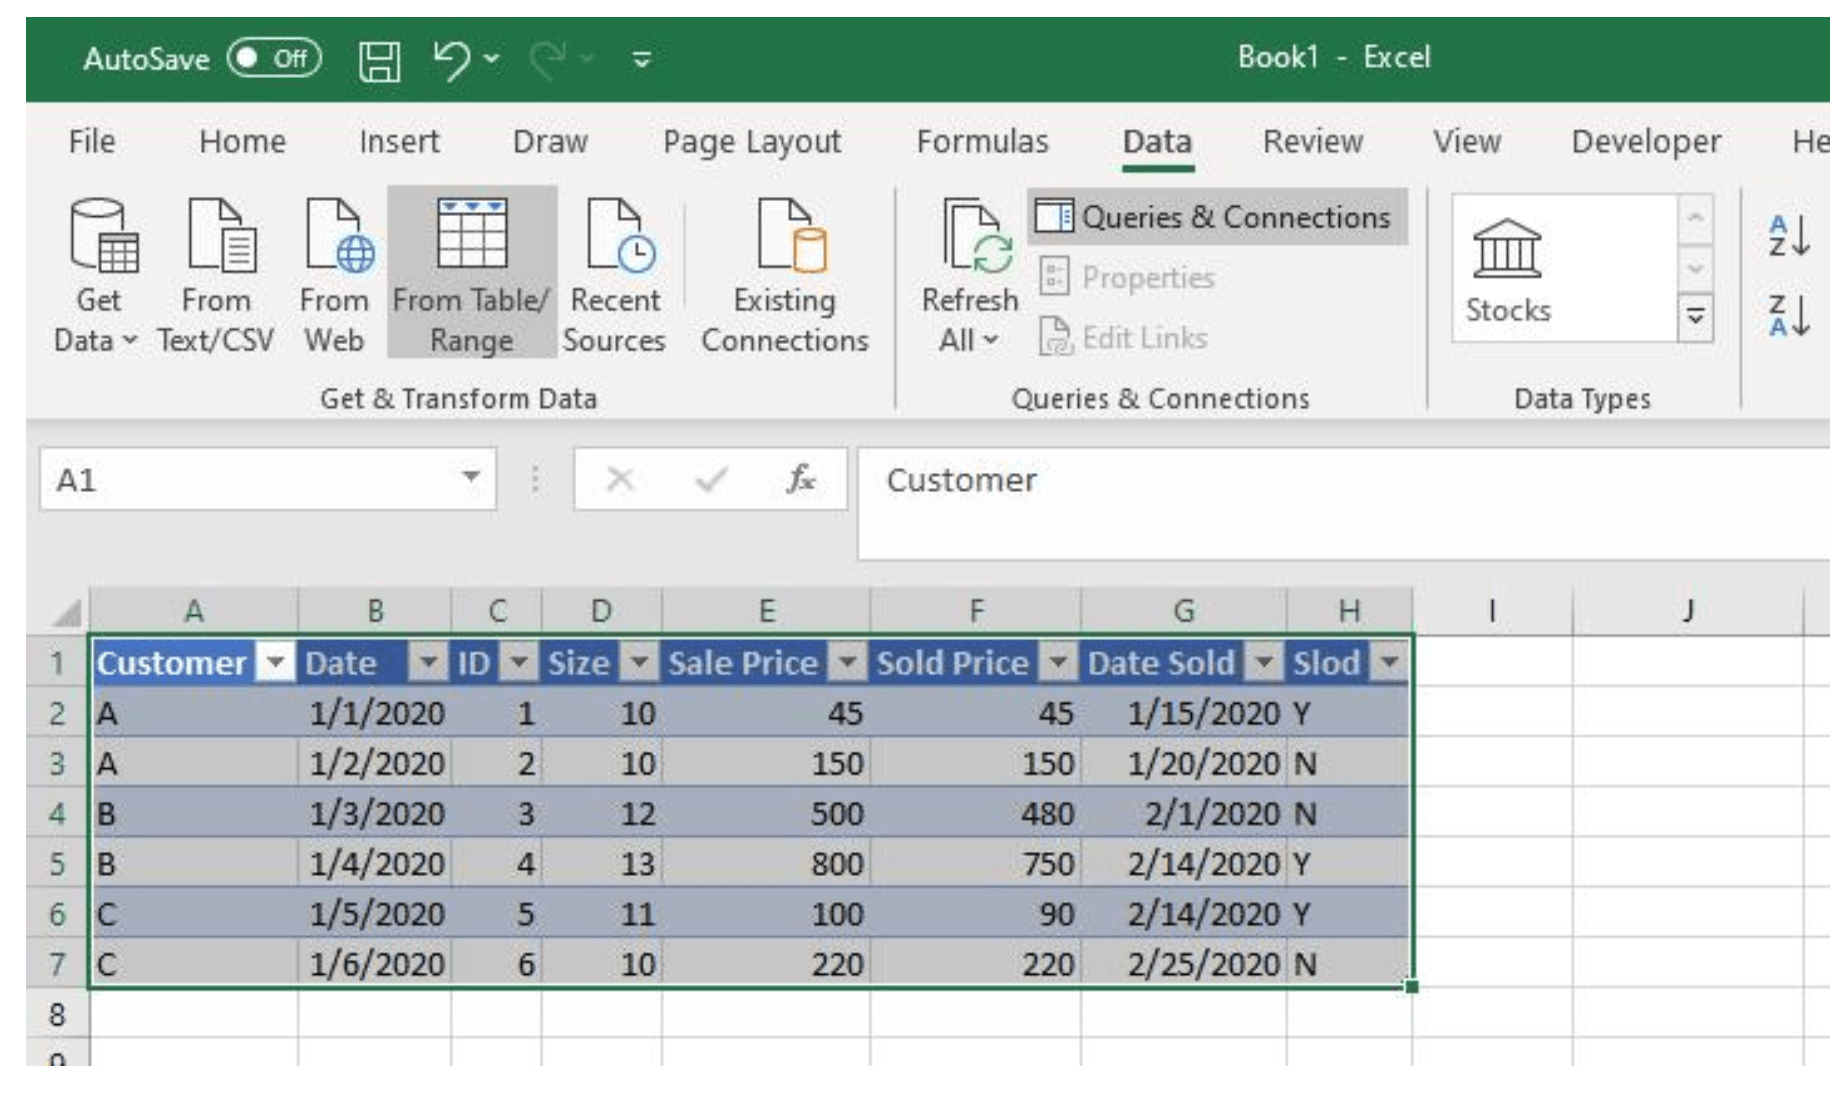
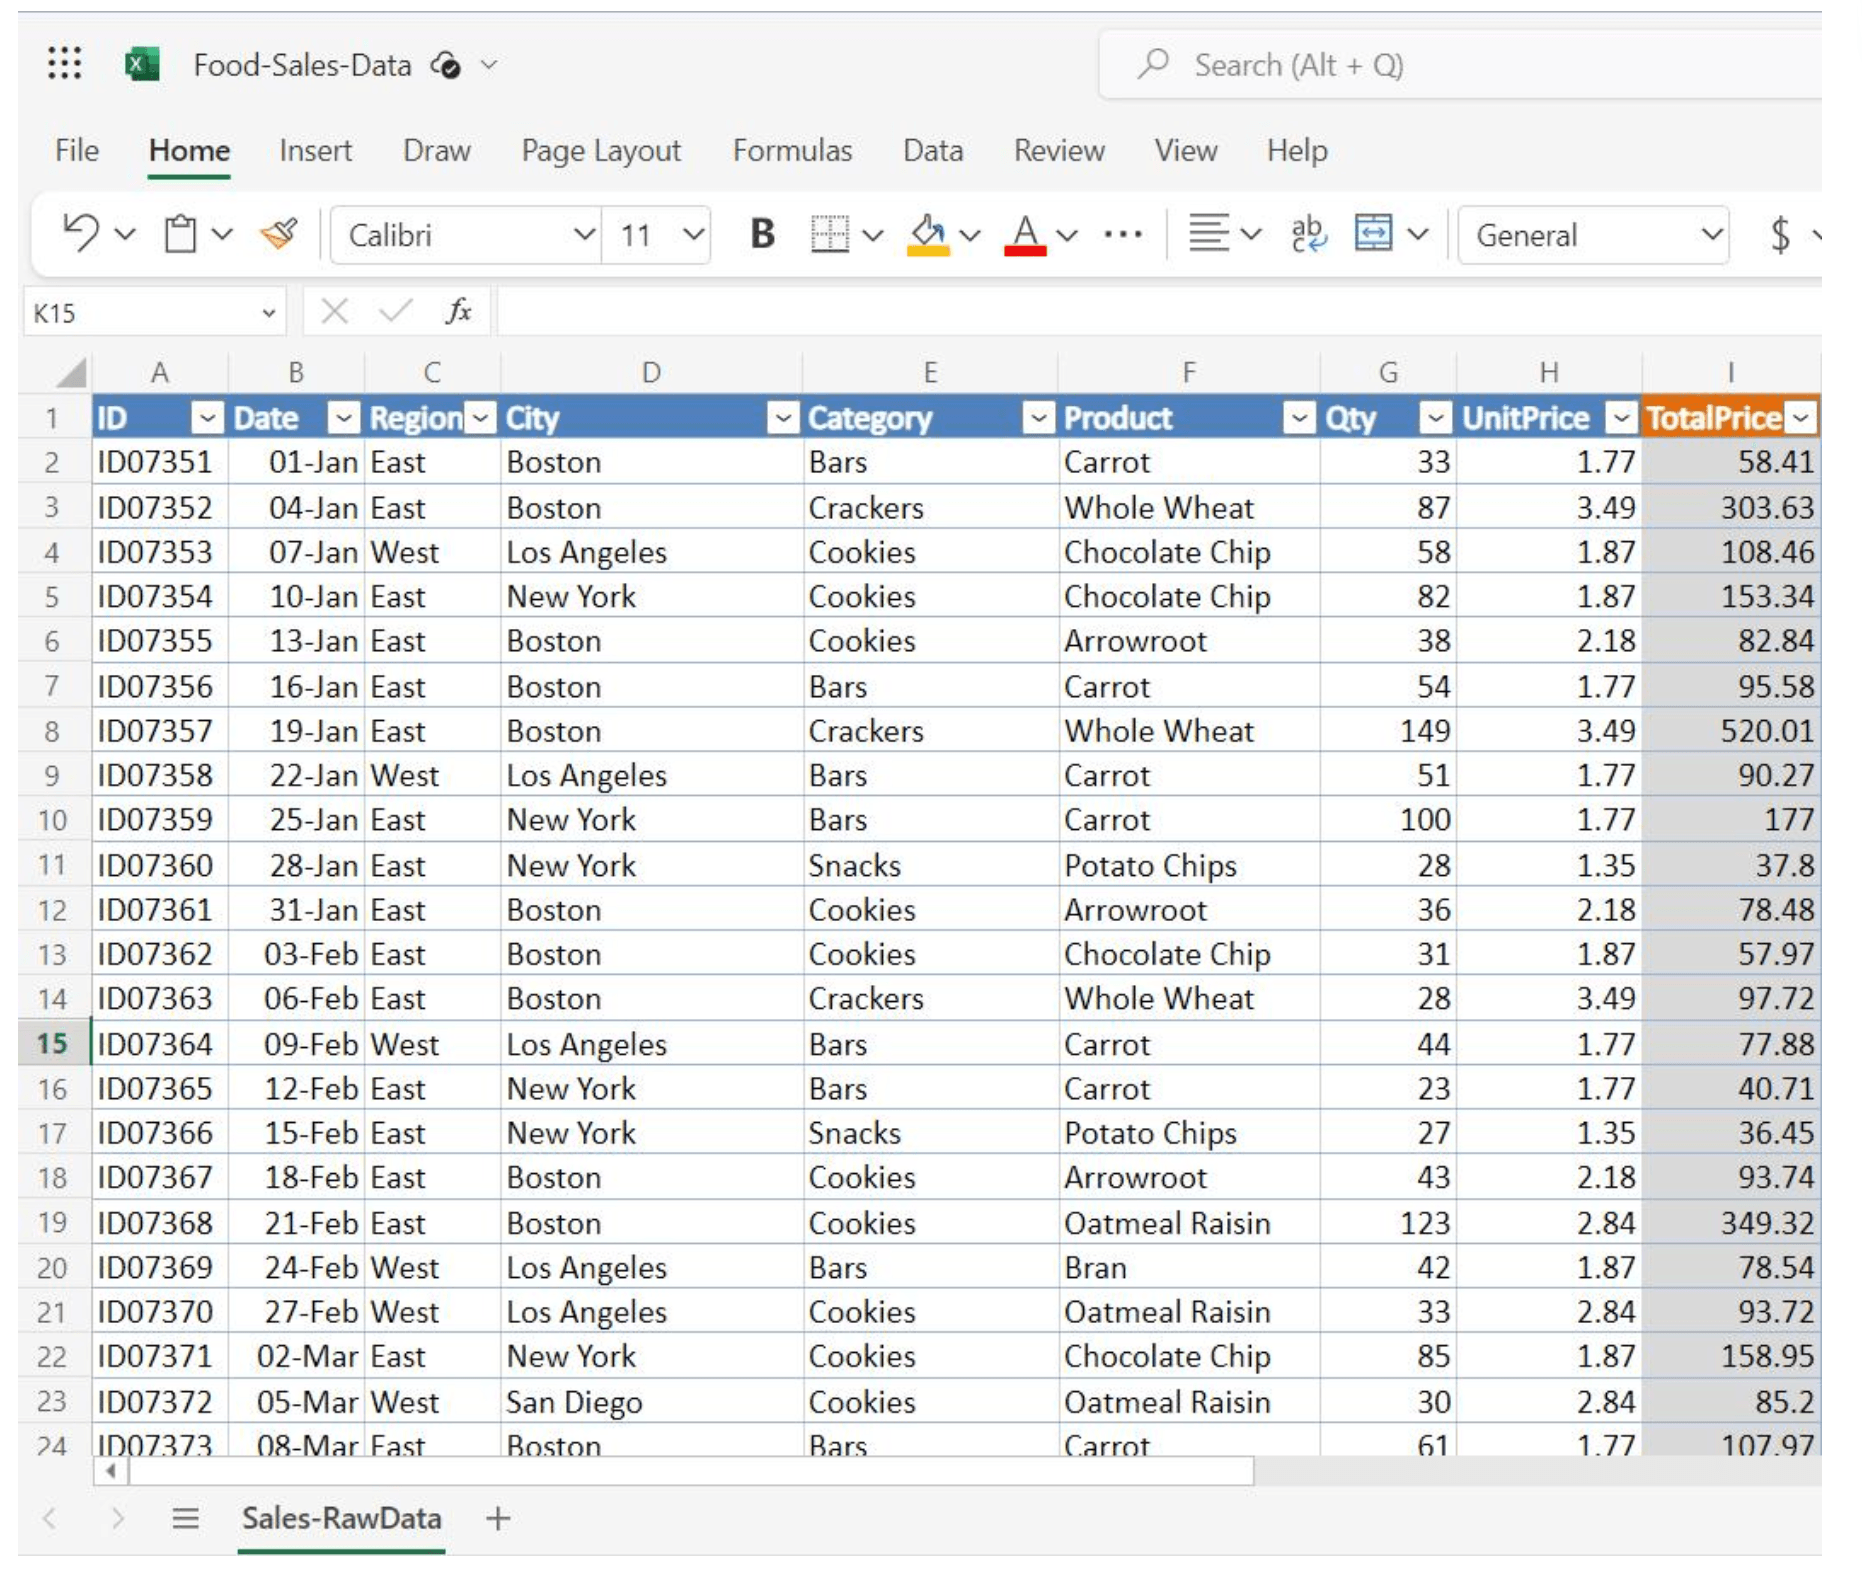
Clean and structured data is the foundation of every effective MIS report.
Best Practices
- Remove blank rows
- Remove duplicate records
- Use proper headings
- Convert data into Excel Tables
Step 2: Use Important Excel Formulas
Some essential formulas used in MIS Reports include:
SUMIFS
=SUMIFS(E:E,C:C,"Laptop")
Calculates total sales by category.
COUNTIFS
=COUNTIFS(C:C,"Laptop")
Counts records matching specific conditions.
XLOOKUP
=XLOOKUP(A2,Data!A:A,Data!B:B)
Retrieves information instantly.
IF Function
=IF(E2>100000,"Target Achieved","Need Improvement")
Creates logic-based reports.
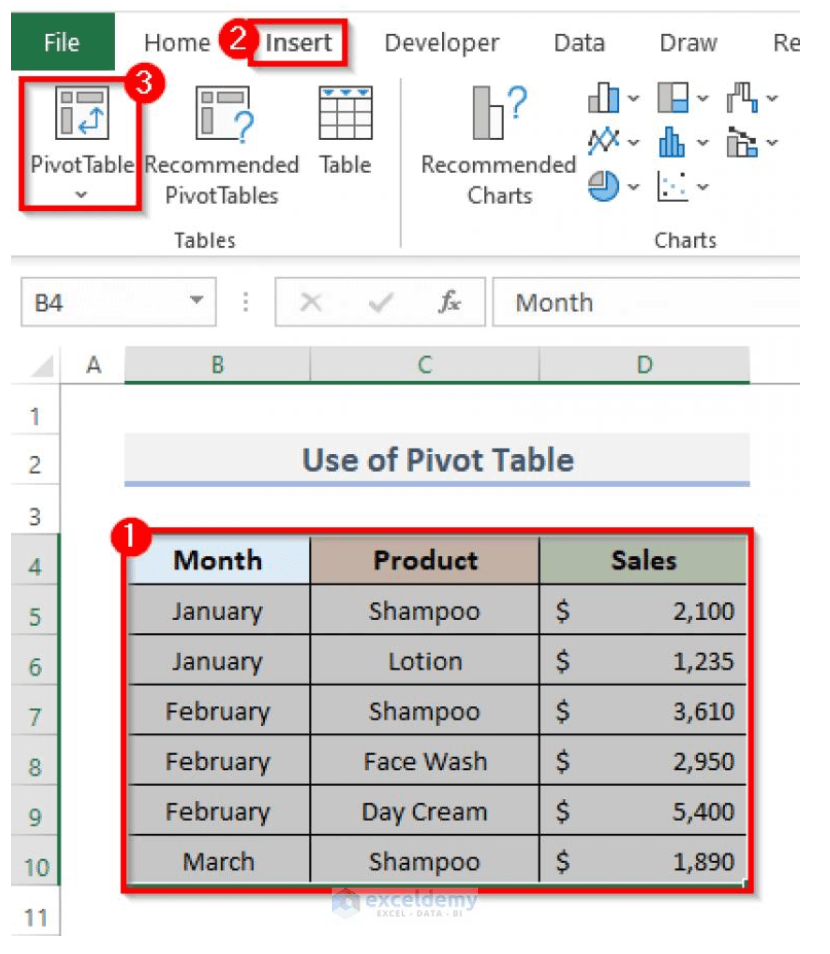
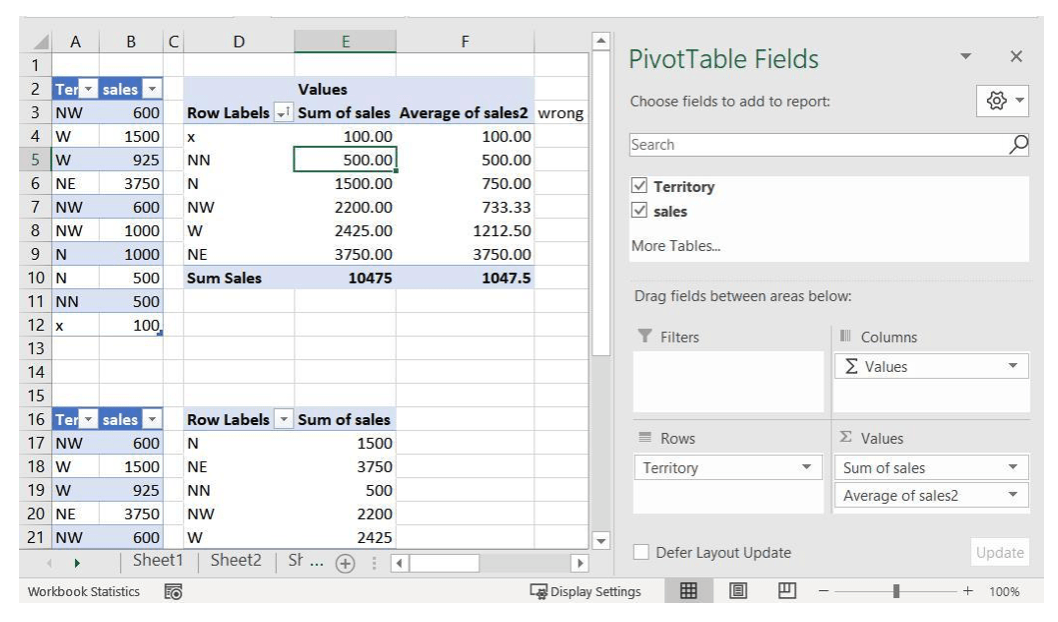
Step 3: Create Pivot Tables
Pivot Tables are considered the heart of MIS Reporting.
Pivot Tables help summarize thousands of rows of data within seconds.
Use Pivot Tables to:
- Summarize Data
- Analyze Sales
- Compare Performance
- Generate Monthly Reports
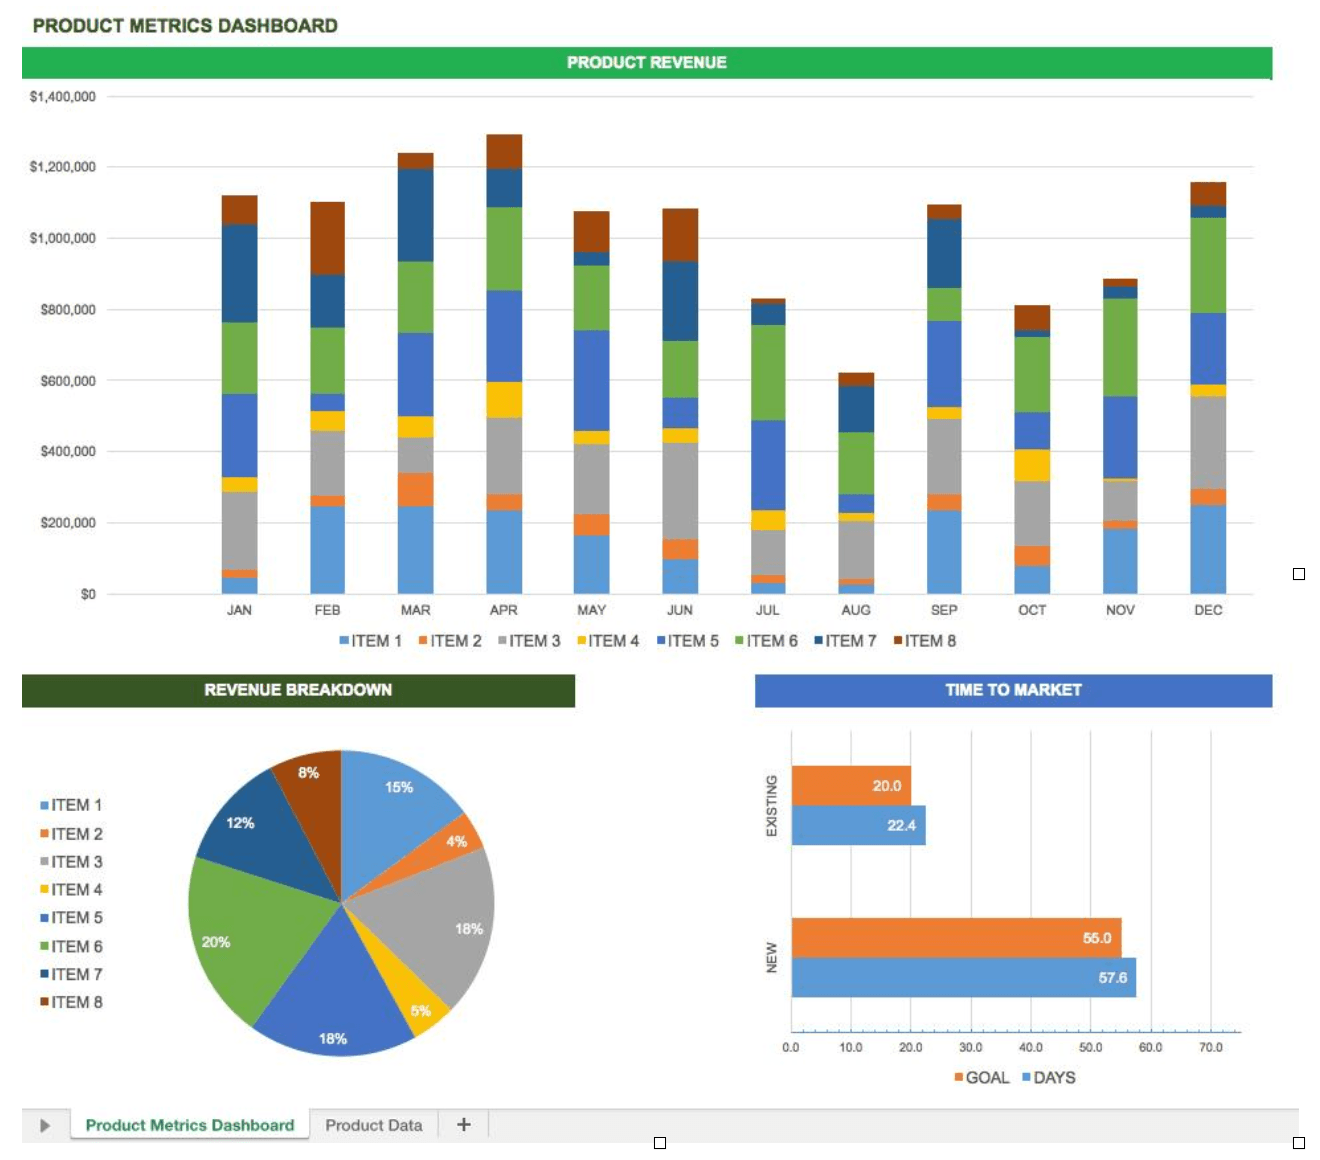
Step 4: Add Charts and Visualizations
Management prefers visual reports over raw numbers.
Create:
- Column Charts
- Line Charts
- Pie Charts
- Bar Charts
Step 5: Apply Conditional Formatting
Conditional Formatting highlights important information automatically.
Examples:
- Top Performers
- Low Sales
- Targets Achieved
- Pending Tasks
Path: Home → Conditional Formatting
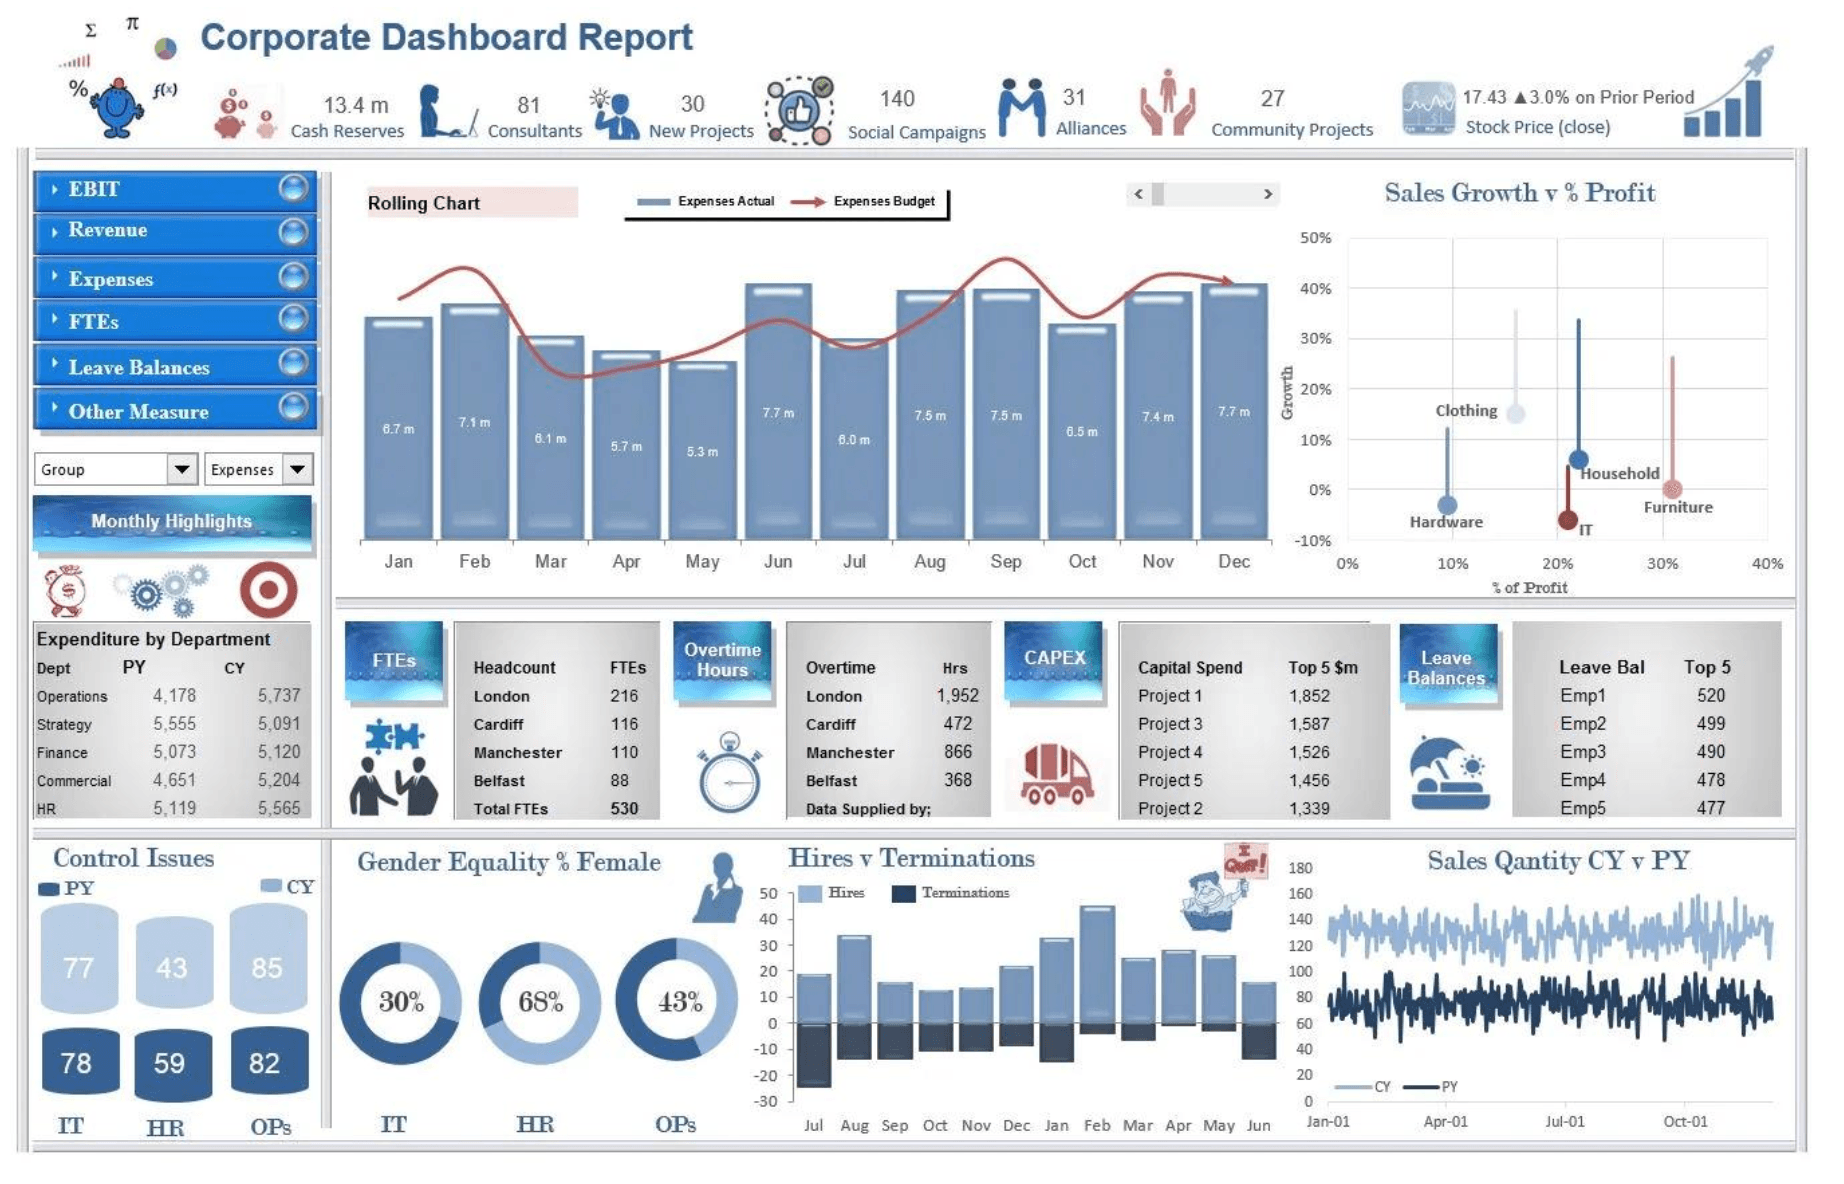
Step 6: Build an MIS Dashboard
Combine multiple Excel tools into a single dashboard.
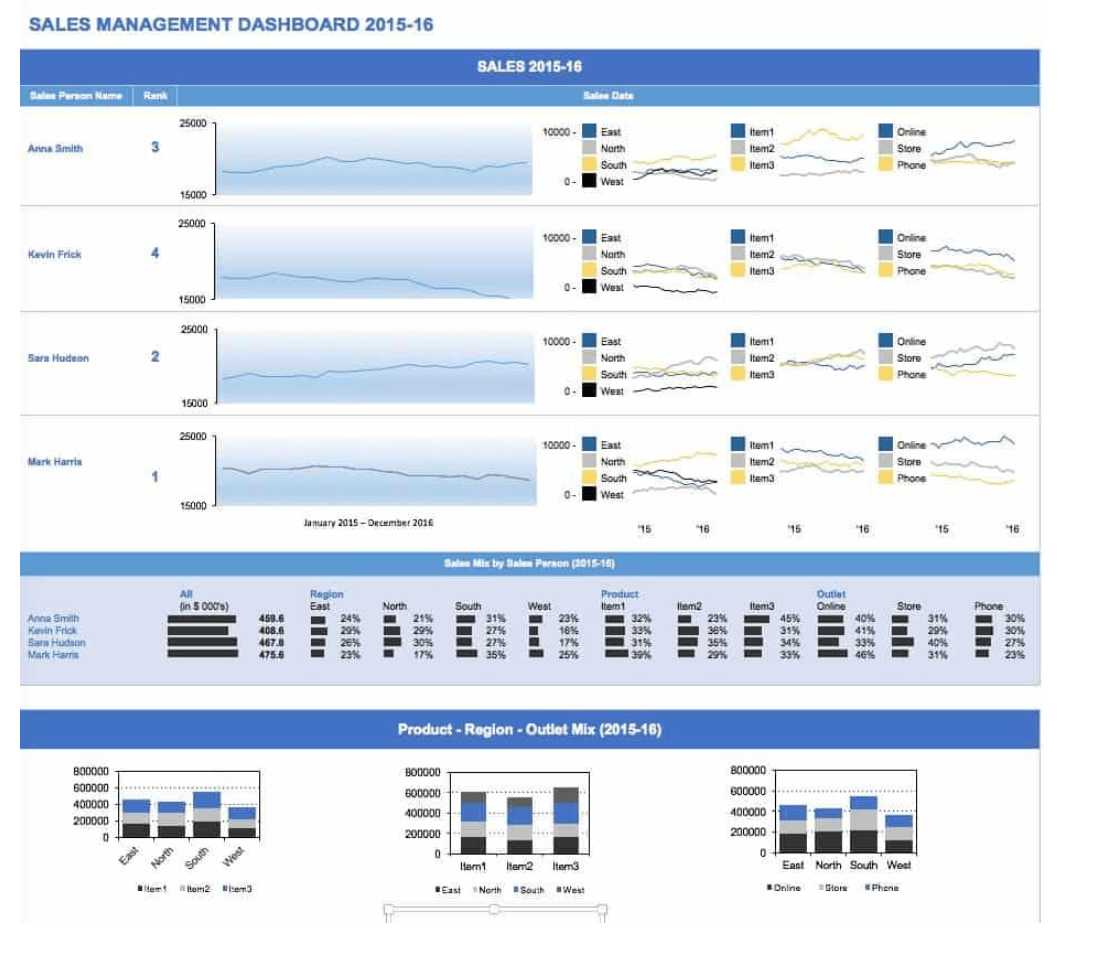
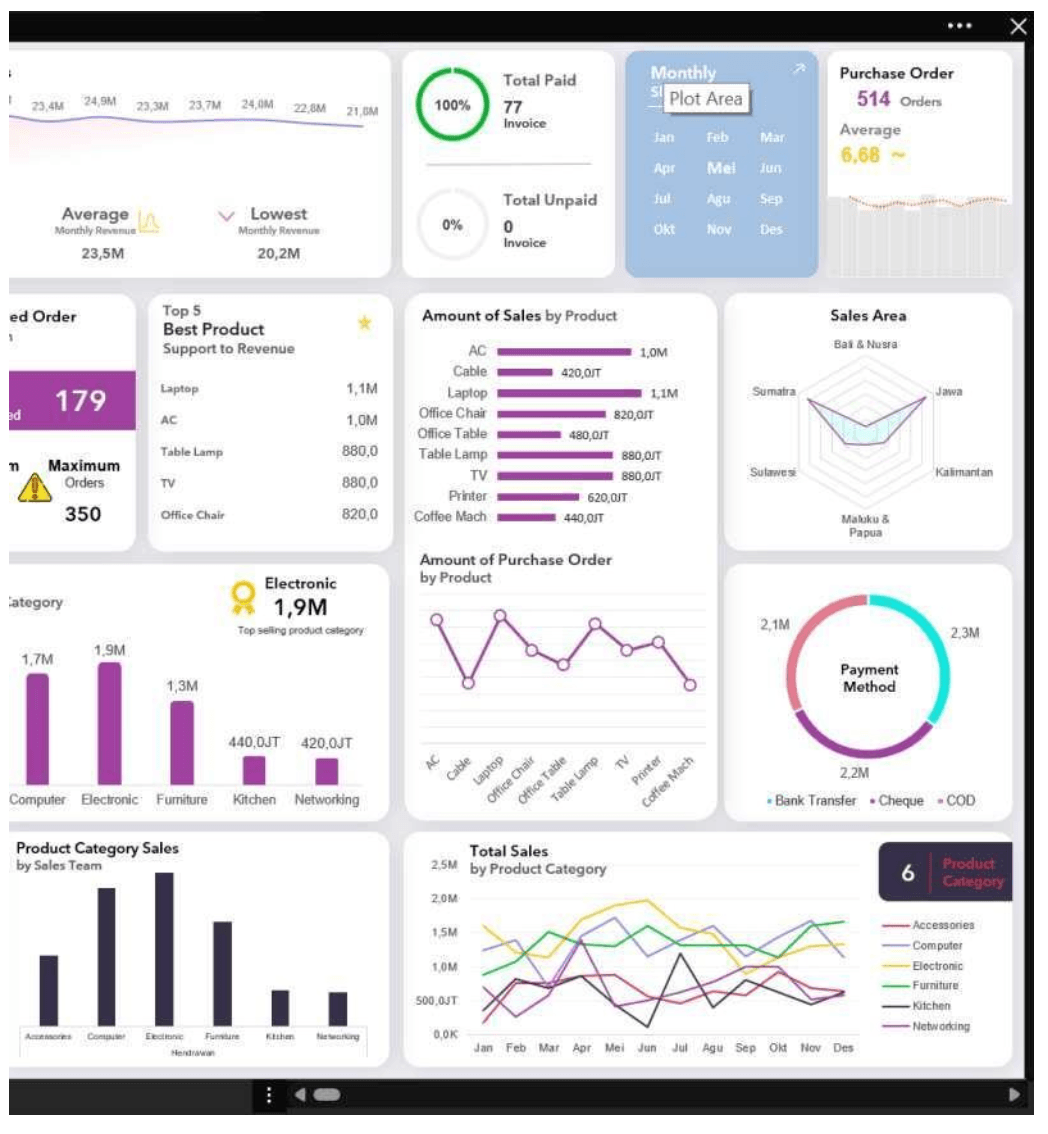
Dashboards present KPIs, trends, and business performance on a single screen.
Your dashboard should display:
- Total Revenue
- Monthly Growth
- Top Performer
- Low Performing Products
Real-World Applications of MIS Reporting
| Department | Usage |
|---|---|
| Sales | Track monthly sales performance |
| Finance | Monitor revenue and expenses |
| HR | Analyze attendance and productivity |
| Accounts | Prepare management reports |
| Business Owners | Track company performance |
Excel Interview Questions on MIS Reporting
What is MIS Reporting?
MIS Reporting is the process of collecting and presenting business data to support decision-making.
Which Excel functions are commonly used in MIS?
SUMIFS, COUNTIFS, XLOOKUP, IF, INDEX-MATCH, and Pivot Tables.
Why are Pivot Tables important?
They summarize large datasets quickly and efficiently.
Is MIS Reporting a good career?
Yes. MIS Executive roles are in high demand across industries.
Can beginners learn MIS Reporting?
Absolutely. With practical training and guidance, anyone can learn it.
Free Learning Resources
Why Learn MIS Reporting at BPA Educators?
- Live Projects
- Real Business Data
- Dashboard Creation
- Advanced Excel Formulas
- Interview Preparation
- Practical Assignments
- Placement Assistance
Whether you’re a student, graduate, accountant, or working professional, MIS Reporting can significantly improve your career opportunities. :contentReference[oaicite:2]{index=2}
Key Takeaways
- MIS Reports help businesses make better decisions.
- Excel is one of the best tools for MIS Reporting.
- Pivot Tables, Charts, and Dashboards are essential.
- MIS Reporting skills are highly valued by employers.
- Advanced Excel improves job prospects.
Ready to Become an MIS Reporting Expert?
Don’t just learn Excel. Learn how companies actually use Excel.
Master:
- Advanced Excel
- MIS Reporting
- Dashboards
- Tally Prime with GST
- Computer Applications
Book Your FREE Demo Class Today
📍 BPA Educators, Rohini, Delhi
📚 Free Learning Resources
Access free Excel tutorials, shortcuts, notes, and learning resources.
📘 Excel Training 🎥 Excel Youtube Playlist 📊 Excel Shortcuts 📈 Resources 📚 BPA Official Website 🎯 Contact for Free Demo
