

 bpaeducators
Pivot Tables Explained: The Secret to Smart MIS Reporting | Advanced Excel Course in Rohini, Delhi
Learn one of the most powerful Excel features used by Accountants, MIS Executives, Finance Professionals, Data Analysts and Business Owners to create reports in minutes instead of hours.
Book FREE Demo ClassTable of Contents
- What is a Pivot Table?
- Why Pivot Tables are Important
- Benefits of Pivot Tables
- Step-by-Step Tutorial
- Practical MIS Reports
- Common Mistakes
- Career Opportunities
- Why BPA Educators?
- FAQs
- Free Resources
Still Spending Hours Creating Reports in Excel?
Imagine your manager asks you:
Many beginners start filtering rows, copying data, and creating formulas manually. It takes hours, and mistakes are common.
Now imagine doing the same task in less than two minutes.
That’s the power of Pivot Tables in Microsoft Excel.
Pivot Tables are one of the most valuable Excel tools for Accountants, MIS Executives, Data Analysts, Business Owners, HR Professionals, and Office Executives. If you’re looking for a Computer, Excel and Tally Training Institute in Rohini, Delhi, mastering Pivot Tables is a skill that can make your resume stand out.
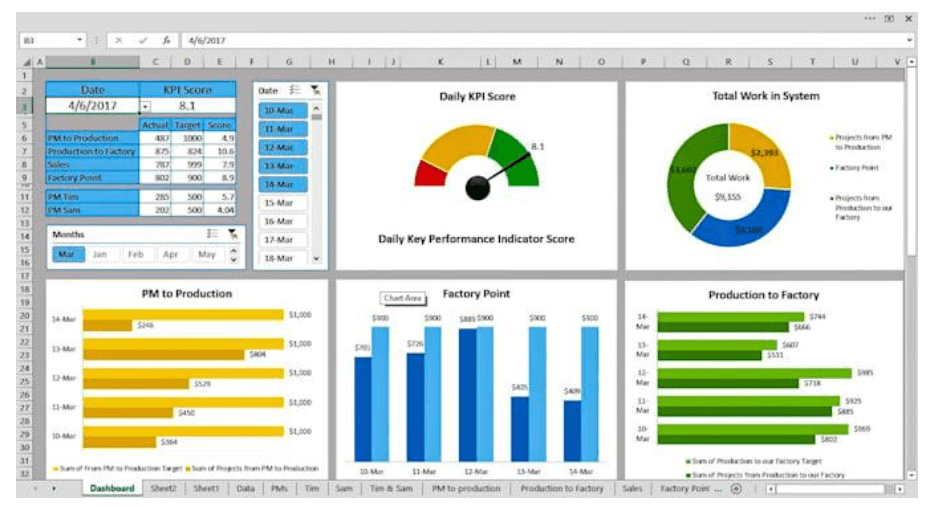
Why Every Professional Should Learn Pivot Tables
Whether you work in accounting, finance, HR, operations, sales, or management, you will eventually deal with large amounts of data. Instead of manually creating reports, Pivot Tables automatically summarize information, helping professionals make faster and smarter business decisions.
What is a Pivot Table?
A Pivot Table is an Excel feature that summarizes, organizes, and analyzes large amounts of data without writing complex formulas.
Instead of manually calculating totals, Pivot Tables allow you to:
Summarize Data
Summarize thousands of records within seconds.
Compare Performance
Compare sales by month, product, city, state, employee, or region.
Count Transactions
Count invoices, customers, orders, employees, or any other business records.
Calculate Totals
Generate totals, averages, percentages, minimums, maximums, and many other summaries.
Interactive Reports
Filter reports instantly without changing the original data.
Professional MIS Reports
Create reports that management can understand and use for decision making.
This makes Pivot Tables one of the most important tools for business reporting and MIS Reporting.

Why Are Pivot Tables Important for MIS Reporting?
MIS (Management Information System) Reports help management make informed decisions. Pivot Tables simplify this process by turning raw data into meaningful insights that can be understood instantly.
Benefits of Using Pivot Tables
- Save hours of manual work
- Analyze large datasets quickly
- Reduce reporting errors
- Create interactive reports
- Support faster business decisions
- Improve productivity
| Traditional Reporting | Pivot Table Reporting |
|---|---|
| Manual calculations | Automatic summaries |
| Multiple formulas | No complex formulas required |
| Time-consuming | Completed in minutes |
| Higher chances of mistakes | More accurate analysis |
| Difficult to update | Refresh with one click |
Business Insight
Professionals in finance, HR, sales, operations, logistics, banking, manufacturing, and accounting rely on Pivot Tables every day to prepare reports for management. Learning this one Excel feature can significantly improve your reporting speed and analytical skills.
Step-by-Step Guide to Creating a Pivot Table
One of the biggest reasons professionals love Pivot Tables is that they can transform thousands of rows of raw data into meaningful reports within minutes. Let’s understand the complete process step by step.
Before You Begin
A Pivot Table is only as good as the data behind it. Spending a few minutes preparing your dataset ensures your reports remain accurate, dynamic, and easy to maintain.
Step 1: Prepare Your Data
Your data should have:
Clear Column Headings
Each column should describe exactly what information it contains.
No Blank Rows
Blank rows interrupt Excel’s ability to detect the complete dataset.
Consistent Formatting
Dates, currency, percentages, and numbers should follow one format.
One Record Per Row
Each row should represent a single business transaction.
Example Columns
| Business Dataset | Example |
|---|---|
| Date | 12-Jul-2026 |
| Customer | ABC Traders |
| Product | Laptop |
| Salesperson | Rahul |
| Quantity | 5 |
| Revenue | ₹250,000 |
| State | Delhi |
Clean data leads to accurate reports. Even the most powerful Pivot Table cannot produce meaningful insights if the underlying data contains blanks, duplicate headings, or inconsistent formatting.

Step 2: Convert Data into an Excel Table
Before inserting a Pivot Table, convert your dataset into an Excel Table.
Keyboard Shortcut
Ctrl + T
Converting your dataset into a table provides several advantages.
- Dynamic data range
- Automatic formatting
- Easy expansion when new records are added
- Better compatibility with Pivot Tables
- Simpler report maintenance
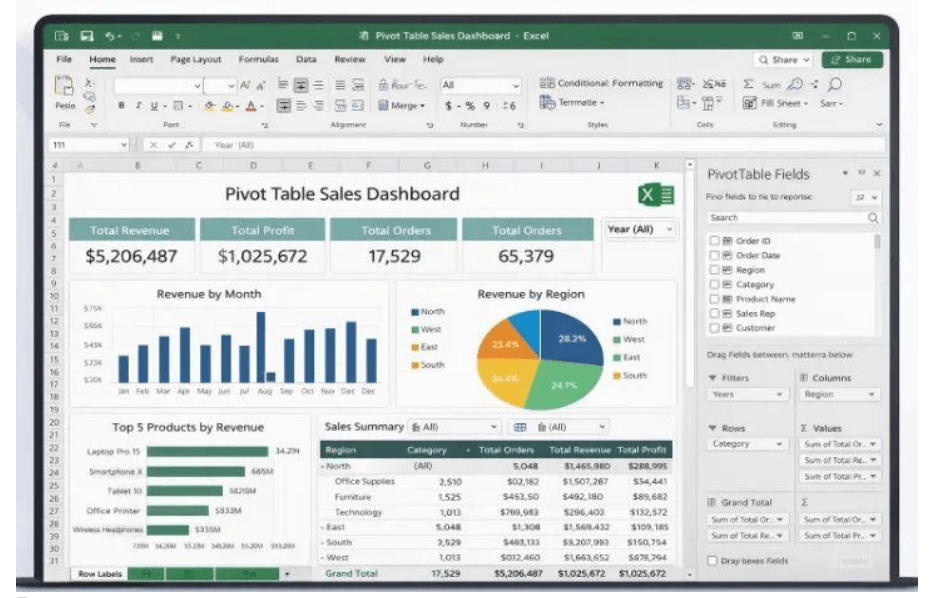
Step 3: Insert a Pivot Table
Once your data is ready, creating the Pivot Table takes only a few clicks.
Insert → PivotTable
Excel will ask where you want to create the report. Choose one of the following options:
New Worksheet
Recommended for beginners because it keeps reports separate from the original dataset.
Existing Worksheet
Useful when creating dashboards or combining multiple reports on one sheet.
Excel immediately creates a blank Pivot Table layout that is ready for analysis.
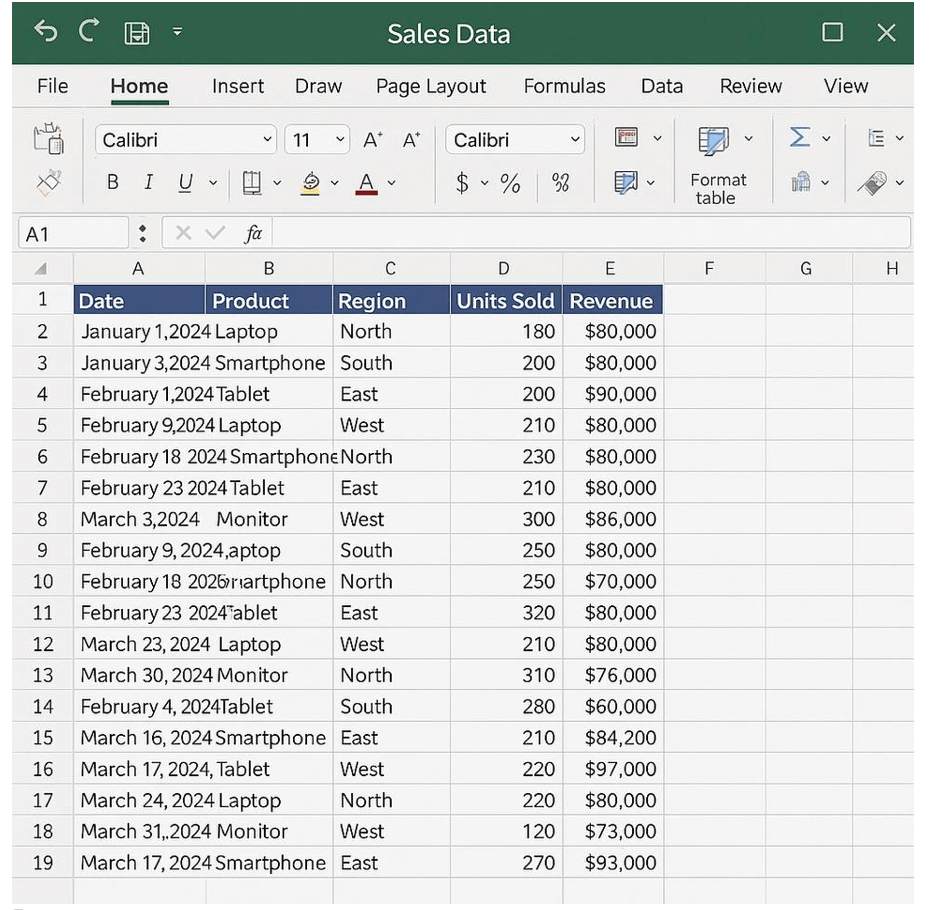
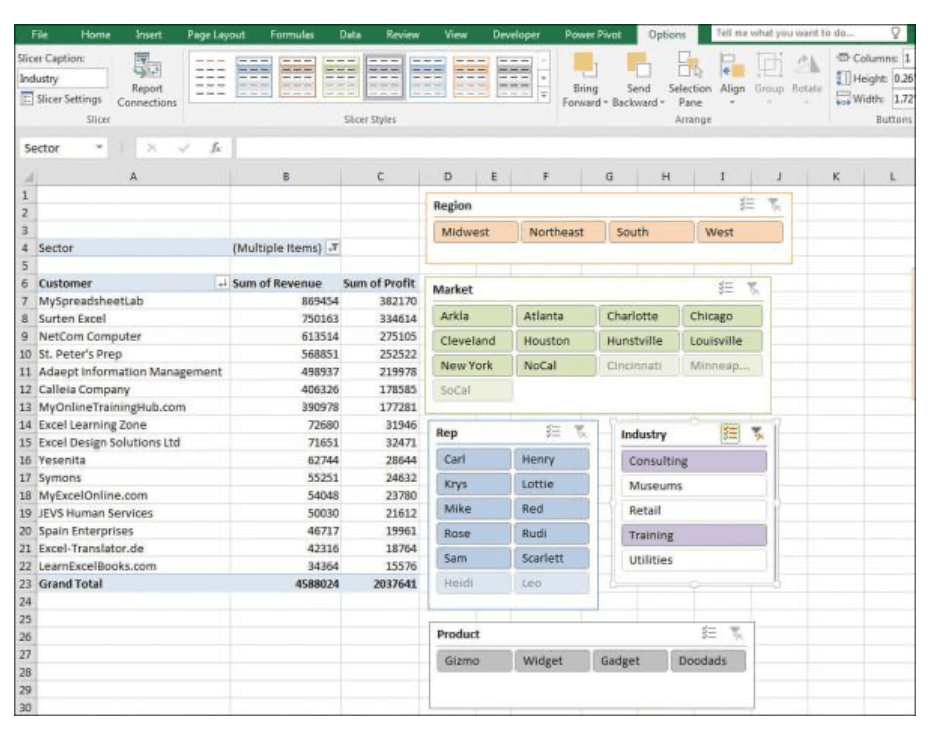
Step 4: Build Your Report
Now comes the most interesting part. Instead of writing formulas, simply drag fields into different sections of the Pivot Table.
| Area | Example Field |
|---|---|
| Rows | Product |
| Columns | Month |
| Values | Sales Amount |
| Filters | Region |
Result
Within seconds, Excel automatically generates a professional sales summary showing revenue by product, month, and region without writing a single formula.
Step 5: Format Your Pivot Table
A well-designed report is easier to understand and looks more professional during meetings and presentations.
Apply Pivot Table Styles
Use built-in styles for better readability.
Format Numbers
Display sales values as Currency and percentages where required.
Sort Values
Arrange products, customers, or cities in ascending or descending order.
Rename Headings
Use meaningful names that managers can understand immediately.
Show Grand Totals
Always display totals for quick business analysis.
Apply Filters
Allow users to analyze specific months, departments, or regions instantly.

Formatting may seem like a small step, but well-presented reports improve readability and create a strong impression during client presentations, management meetings, and job interviews.
Practical MIS Reports You Can Create Using Pivot Tables
One of the biggest advantages of Pivot Tables is their flexibility. The same dataset can be summarized in multiple ways depending on what information management needs. Instead of creating multiple reports manually, Pivot Tables allow professionals to generate different business reports within minutes.
From Raw Data to Business Decisions
Businesses don’t make decisions using thousands of rows of data—they make decisions using summaries, trends, comparisons, and KPIs. Pivot Tables convert raw transactions into meaningful reports that management can understand immediately.
1. Sales Analysis Report
Sales teams frequently use Pivot Tables to analyze product performance, regional sales, and monthly growth.
Track Monthly Sales
Compare sales performance month by month to identify seasonal trends and business growth.
Product Performance
Identify best-selling and slow-moving products within seconds.
Salesperson Targets
Measure each salesperson’s contribution and performance.
Revenue Growth
Monitor business growth using summarized sales data.
2. Expense Report
Finance departments rely on Pivot Tables to understand where business expenses are increasing and where budgets can be optimized.
- Department-wise Expenses
- Monthly Costs
- Budget vs Actual Analysis
- Vendor-wise Payments
- Expense Category Analysis
Expense reports help management control unnecessary spending and improve profitability by identifying high-cost areas.
3. Attendance Report
HR professionals use Pivot Tables to summarize attendance records without manually counting employee entries.
| Report Type | Purpose |
|---|---|
| Present Days | Calculate employee attendance. |
| Absent Days | Track employee absences. |
| Leave Records | Analyze leave utilization. |
| Department Summary | Compare attendance across departments. |
4. Inventory Report
Retail stores, warehouses, distributors, and manufacturers frequently use Pivot Tables for inventory management.
Stock Levels
Monitor available inventory across warehouses.
Fast Moving Products
Identify products with high sales demand.
Slow Moving Inventory
Detect products occupying storage unnecessarily.
Low Stock Alerts
Recognize products requiring immediate replenishment.
5. GST & Accounting Report
Accountants regularly prepare summarized GST and accounting reports using Pivot Tables after exporting data from Tally Prime or ERP software.
- Sales Summary
- Purchase Summary
- GST Tax Amount
- Customer Transactions
- Vendor Transactions
- Outstanding Receivables
- Outstanding Payables
Real Office Scenario
Many accountants export data from Tally Prime into Excel and immediately create Pivot Tables to prepare monthly GST summaries, customer-wise reports, outstanding statements, and management reports.
Common Mistakes Beginners Make
Although Pivot Tables are simple to use, beginners often make small mistakes that lead to incorrect reports. Understanding these mistakes early helps you create reliable and professional reports.
Using Blank Rows
Blank rows prevent Excel from identifying the complete dataset, causing records to be excluded from the Pivot Table.
Incorrect Data Format
Dates stored as text cannot be grouped correctly, making monthly and yearly analysis difficult.
Forgetting to Refresh
Whenever new data is added, always use Right Click → Refresh so the Pivot Table includes the latest records.
Duplicate Column Names
Each column must have a unique heading for Excel to generate accurate Pivot Tables.
| Common Mistake | Recommended Solution |
|---|---|
| Blank Rows | Remove all empty rows before creating the Pivot Table. |
| Blank Headings | Ensure every column has a descriptive heading. |
| Mixed Data Types | Keep dates, numbers, and text properly formatted. |
| Not Refreshing | Refresh the Pivot Table after adding new records. |
Excel Skills That Work Best with Pivot Tables
To become an MIS Executive or Reporting Analyst, Pivot Tables should be combined with other Advanced Excel tools.
VLOOKUP
XLOOKUP
SUMIFS
COUNTIFS
IF Function
Conditional Formatting
Charts
Slicers
Timelines
Dashboards
Power Query
Mastering Pivot Tables alone is valuable, but combining them with formulas, dashboards, Power Query, and charts transforms you into a complete reporting professional capable of handling complex business reporting requirements.
Career Opportunities After Learning Pivot Tables
Pivot Table skills are among the most frequently requested Excel skills in job descriptions because businesses rely on data-driven decision-making.
| Industry | How Pivot Tables Are Used |
|---|---|
| Accounting Firms | Financial reporting, GST summaries, client analysis. |
| Corporate Finance | Budget analysis and management reporting. |
| Retail Companies | Sales and inventory reporting. |
| Manufacturing | Production and inventory analysis. |
| HR Departments | Attendance and payroll reporting. |
| Banking | Customer transaction analysis. |
| Logistics | Shipment and warehouse reporting. |
| Sales Operations | Sales dashboards and performance tracking. |
Popular Job Roles
- MIS Executive
- Data Analyst
- Accounts Executive
- Finance Executive
- Reporting Analyst
- Business Analyst
- Office Executive
Career Tip
Employers increasingly test Pivot Tables during Excel interviews. Being comfortable with data summarization, filtering, grouping, and dashboard creation can significantly improve your chances of securing roles in accounting, MIS reporting, finance, operations, and business analysis.
Frequently Asked Questions (FAQs)
Are Pivot Tables difficult to learn?
No. Once you understand the basics, Pivot Tables become one of the easiest and most powerful Excel features. Most learners become comfortable after creating just a few reports using real business data.
Do I need formulas to use Pivot Tables?
No. Pivot Tables summarize and analyze data without requiring complex formulas. However, combining Pivot Tables with formulas like XLOOKUP, SUMIFS, and IF makes reports even more powerful.
Are Pivot Tables useful in interviews?
Yes. Many companies include Pivot Table questions during Excel assessments because reporting is a daily responsibility in finance, MIS, HR, and operations.
Can beginners learn Pivot Tables?
Absolutely. Beginners can start with small datasets and gradually move towards dashboards, interactive reports, slicers, timelines, and business analytics.
Are Pivot Tables useful for accountants?
Yes. Accountants use Pivot Tables for financial analysis, GST summaries, customer ledgers, purchase analysis, expense reports, bank reconciliation summaries, and MIS reporting.
Can Pivot Tables handle thousands of records?
Yes. Pivot Tables are designed to summarize thousands—even hundreds of thousands—of rows efficiently, making them ideal for business reporting.
Free Learning Resources & Downloads
Continue practicing and improving your Excel skills using these trusted learning resources.
📘 Microsoft Excel Training Center
Learn Excel directly from Microsoft with beginner to advanced tutorials.
📄 Free Excel Templates
Ready-made templates for budgeting, finance, inventory, accounting, payroll, and reporting.
📊 Business Dashboard Templates
Explore professional dashboard templates that work perfectly with Pivot Tables.
🎓 BPA Educators
Join practical Excel training with real business projects and expert guidance.
Why Learn Advanced Excel at BPA Educators?
At BPA Educators, Rohini, students work on practical business projects instead of only learning theory. The objective is to help learners develop real workplace skills that employers expect from modern Excel professionals.
✔ Pivot Tables
Create powerful summaries and business reports within minutes.
✔ Dashboards
Design professional interactive dashboards using charts and Pivot Tables.
✔ MIS Reporting
Prepare management reports used by finance, HR, sales, and operations teams.
✔ Advanced Formulas
Master XLOOKUP, SUMIFS, IF, INDEX-MATCH, and many other essential functions.
✔ Financial Functions
Learn practical Excel techniques for accounting and financial reporting.
✔ Power Query Basics
Automate repetitive reporting tasks and clean large datasets efficiently.
✔ Tally Prime with GST
Combine accounting software with Excel reporting for maximum employability.
✔ Computer Applications
Develop complete office productivity skills.
✔ Live Projects
Practice with real business datasets instead of sample exercises.
✔ Interview Preparation
Prepare for Excel assessments and technical interviews confidently.
✔ Placement Assistance
Career guidance and placement support to help you start your professional journey.
Our Practical Approach
Our practical approach helps students become job-ready from day one by combining Excel, Pivot Tables, MIS Reporting, Dashboards, Power Query, and Tally Prime into one complete learning experience.
Explore Related Courses & Blogs
| Resource | Explore |
|---|---|
| Advanced Excel Course | View Course |
| Tally Prime, Busy & QuickBooks Course | View Course |
| Browse All BPA Blogs | Read Blogs |
Key Takeaways
- ✔ Pivot Tables simplify complex data analysis.
- ✔ They are essential for MIS Reporting and business decision-making.
- ✔ Every Excel learner should master Pivot Tables.
- ✔ Combining Pivot Tables with dashboards and formulas creates powerful business reports.
- ✔ Practical Excel skills improve employability across industries.
Ready to Master Advanced Excel?
Don’t spend hours creating reports manually. Learn the same reporting techniques used every day by Accountants, MIS Executives, Finance Professionals, Data Analysts, HR Managers, and Business Analysts.
Join BPA Educators, Rohini, Delhi and become confident in:
- Advanced Excel
- Pivot Tables
- MIS Reporting
- Dashboards
- Advanced Formulas
- Power Query
- Tally Prime with GST
🎯 Book Your FREE Demo Class Today
📍 Rohini, Delhi
📞 Contact BPA Educators for Course Details, Batch Timings, and Admission Information.